Adopted Market Basket Analysis (adopted MBA)
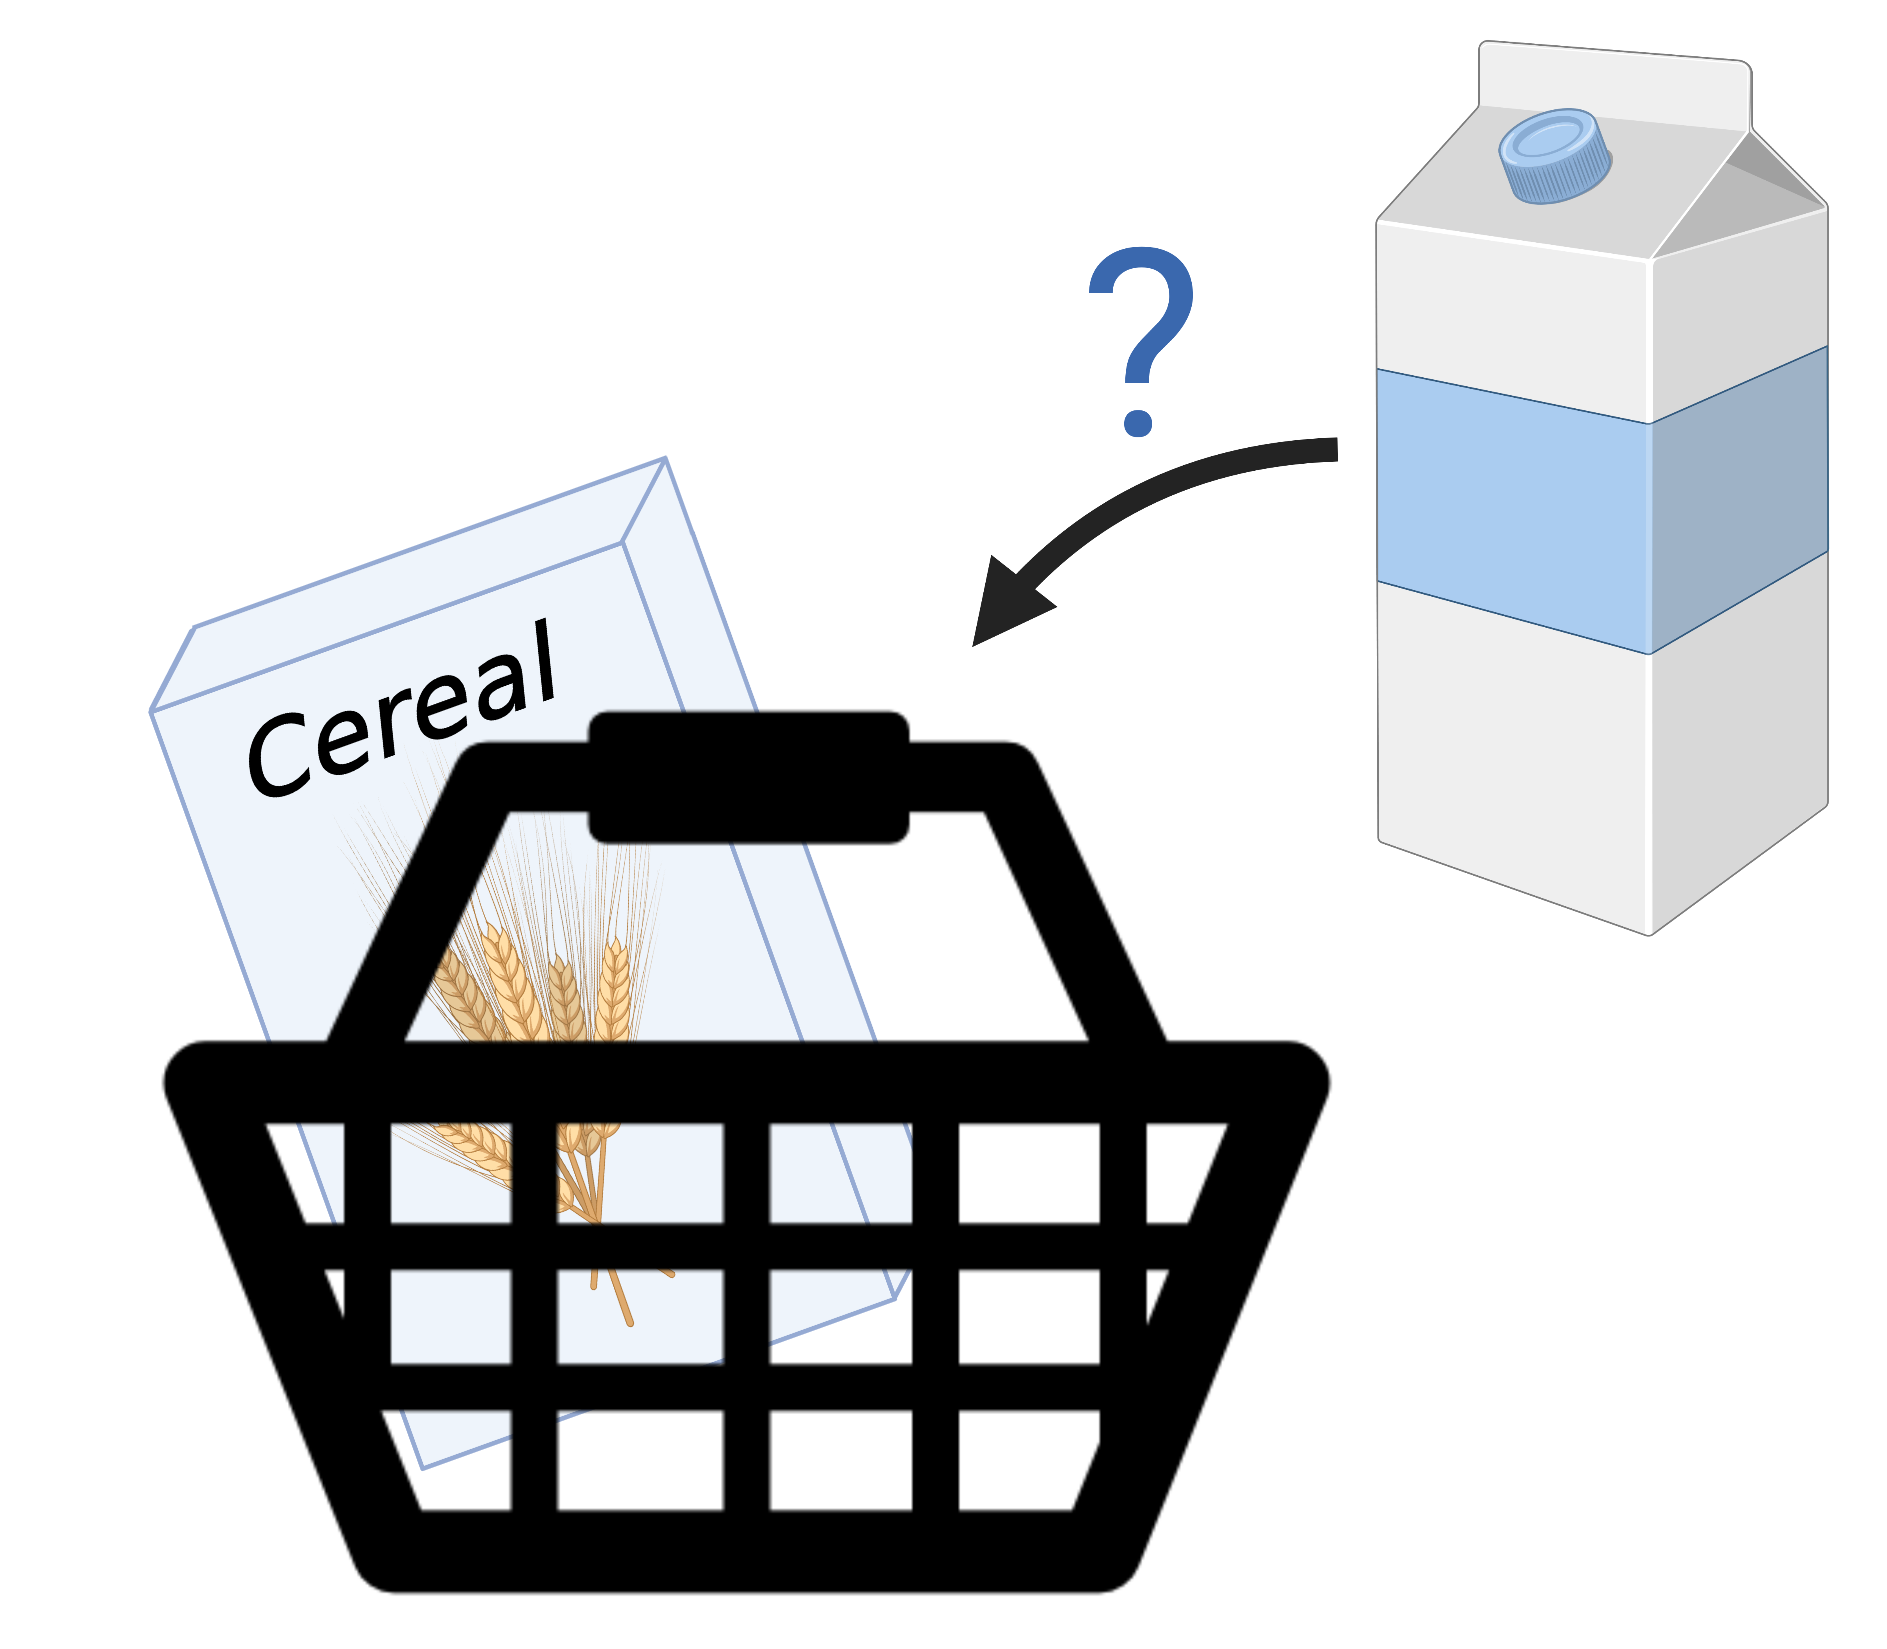
To explore relationships between items bought by customers a frequent pattern mining approach called market basket analysis (MBA) can be applied. The basic idea behind TF-COMB is utilizing such a MBA in a way applicable to transcription factor (TF) binding data to uncover co-occurrences between TFs. Here we present the classical MBA approach and how we altered it to cope with the special biological challenges.
Market Basket Analysis (MBA)
Created with BioRender.com.
support
confidence
But TF binding data is no (super-)market?
As mentioned above we took this approach and asked if we can transfer the concept to be applied to biological data in a way that we can answer the question: “If we observe TFA, is it likely we will also observe TFB?” Assuming TF factors to be items posed some challenges due to the nature of the data, explained below.
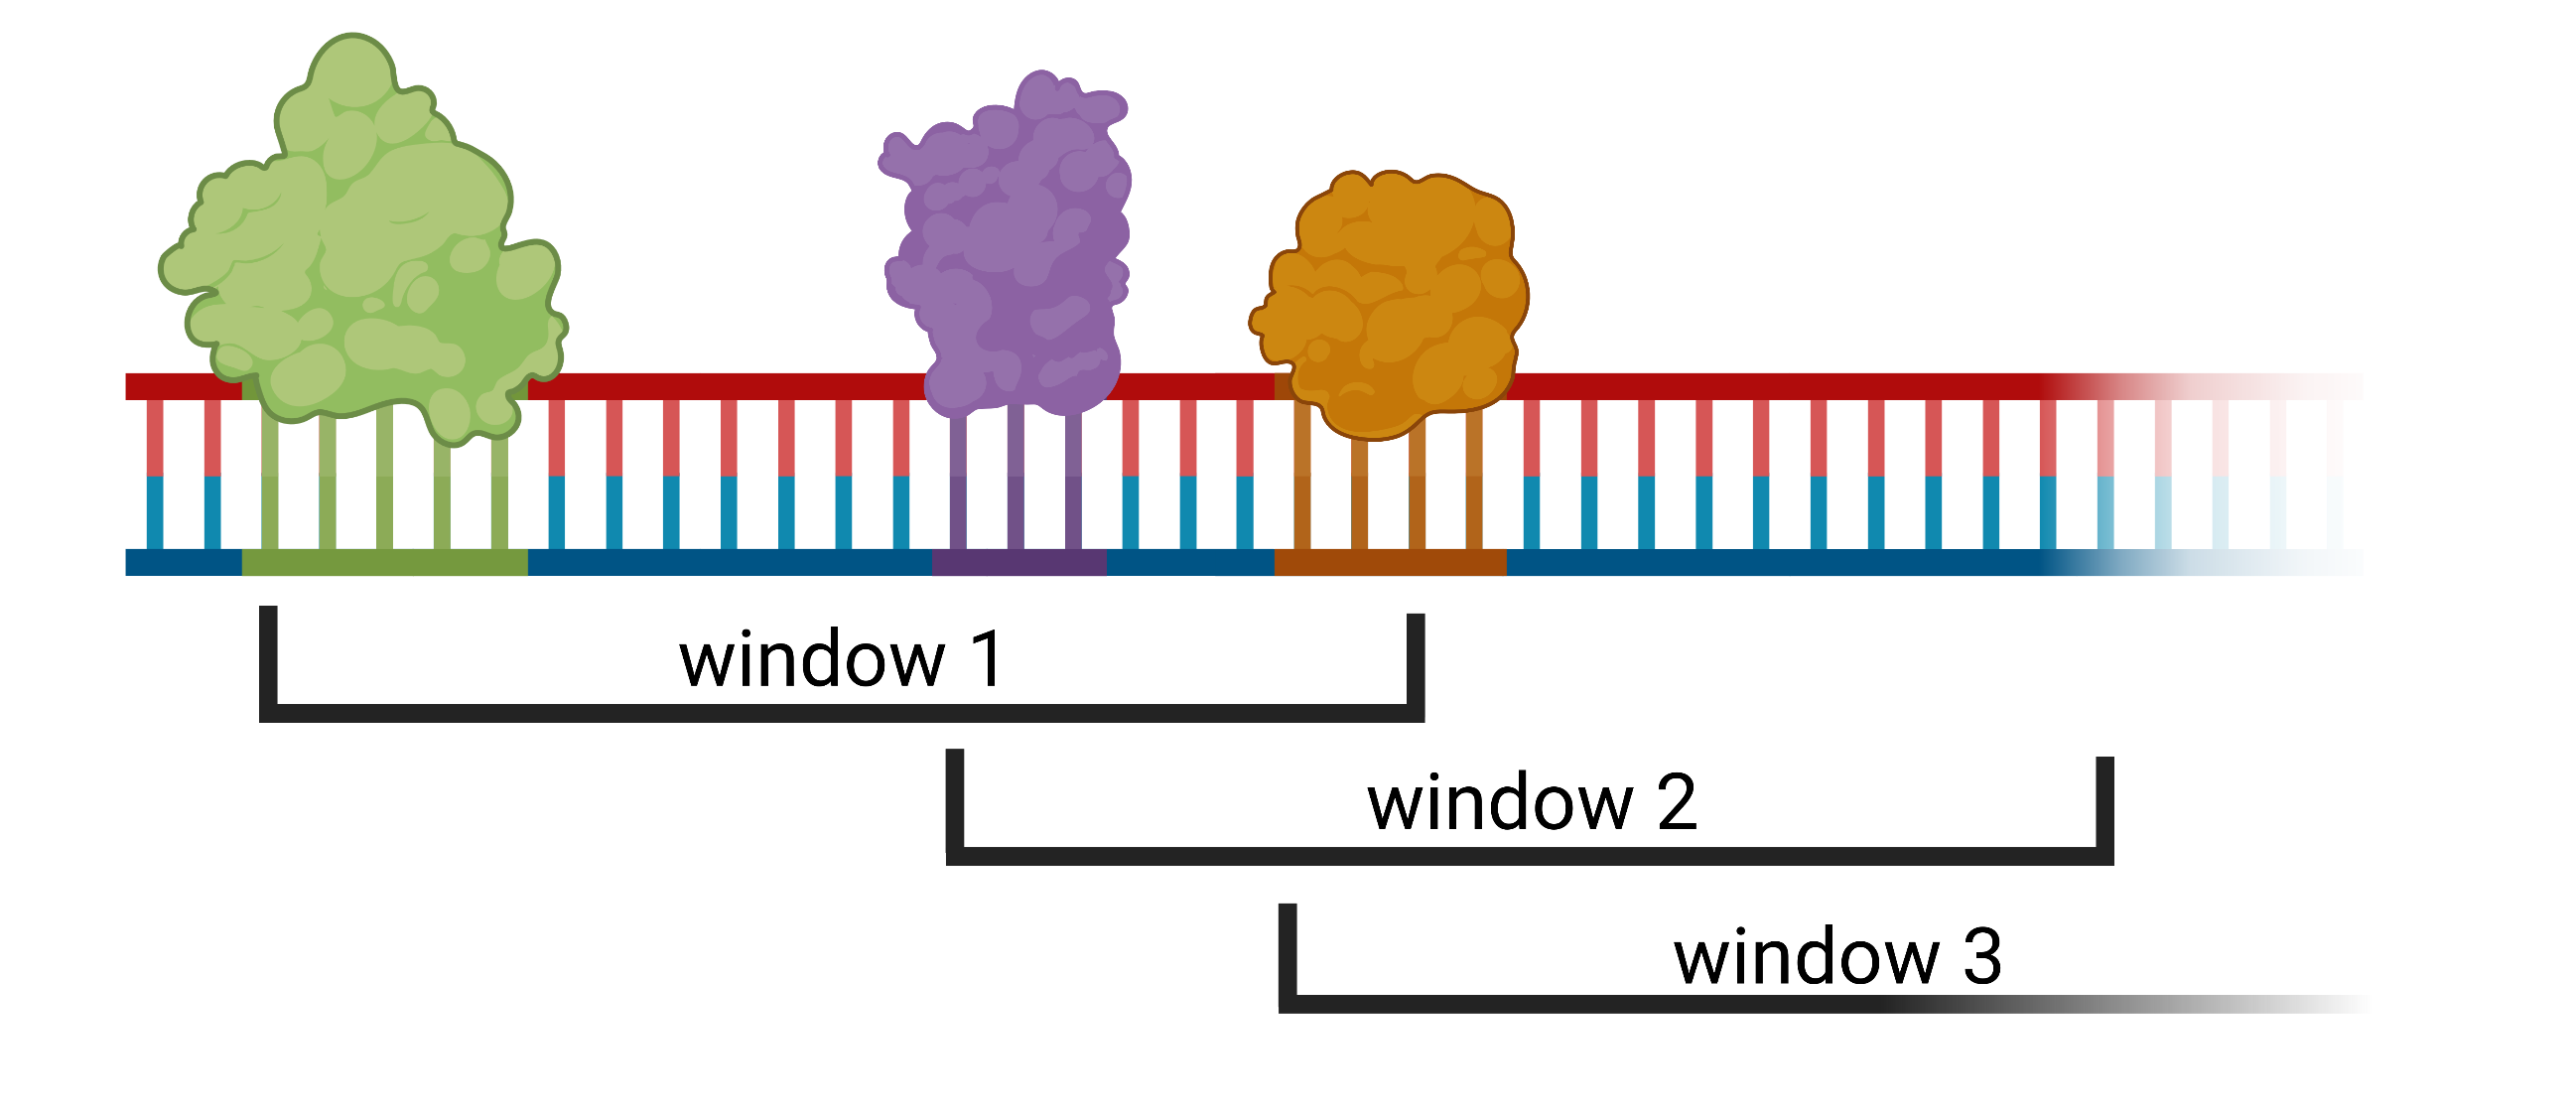
What are transactions/windows in TF binding data?
The first question translating the MBA concept to TF binding data was how to define transactions/baskets. Since we assumed TF factors to be the items we want to examine, we need a counterpart for transactions. Therefore, we constructed arbitrary windows of a given size w. However, the human genome for example is huge and utilizing a sliding window approach to slice the genome is computational expensive as well as resulting in many windows without valuable information content. Therefore, we assumed every genomic TF start position to denote the start of a window, resulting in a number of windows (transactions) equals observed TFs.
Created with BioRender.com.
How we resolved overlapping
TFs and their respective binding sites do not only occur side-by-side but sometimes also overlap each other. To enable full control of these special cases, TF-COMB offers a parameter to control the amount of allowed overlap ranging from 0 (no overlap allowed) to 1 (full overlap allowed). Overlap is calculated in percentage of the shorter binding site overlapping the larger binding site.
Metrics
To assess the importance of the found rules a variety of metrics exist [1] . Besides the above mentioned support, which is calculated automatically, TF-COMB supports cosine, confidence, lift or jaccard.